Southeastern Center for Air Pollution and Epidemiology (SCAPE)
(EPA; Heather Holmes, Sunni Ivey, Siv Balachandran, Mariel Friberg, Wenxian Zhang, Yongtao Hu)
Air pollution concentrations measured from regulatory monitoring networks are commonly used as air quality metrics in time-series epidemiologic analysis to investigate air quality and human health associations. While these data provide useful indicators for air pollution impacts in a region, the data are limited temporally, spatially and chemically. Further, that data cannot directly identify the sources of the pollution. To best utilize this data in health studies in-depth analysis is required, including the use of models to characterize the mixtures, sources and species impacting both individual locations and wider areas. Further, there is growing interest in how pollutant mixtures might combine to impact health. As part of the EPA-funded Southeastern Center for Air Pollution and Epidemiology (SCAPE, http://www.scape.gatech.edu/), a Mixtures Characterization (MC) Toolkit is being developed to effectively analyze air pollution and air quality modeling data to better understand how sources are combining to impact air quality for use in health assessments. In addition to source characterization, exposure estimates are a knowledge gap in health studies, thus the MC Toolkit includes spatial averaging and temporal interpolation components to improve the concentration distribution modeling.
Statistical data analysis is done using species concentrations from ambient monitoring networks to calculate spatial air pollution metrics using both area and population weighted averages (Fig. 1). Source oriented air quality models are also utilized in the MC Toolkit, including a chemical transport model (CTM) to generate spatially and temporally resolved pollutant concentration fields. The CTM used is CMAQ (U.S. EPA), which uses meteorology outputs from a numerical weather prediction model (WRF) and emissions modeling (SMOKE) to generate a spatial and temporal allocation of the source emissions. The CMAQ model incorporates emissions, meteorological and chemical processes but the model output is not nudged or calibrated to observations. Therefore, novel approaches are being develop to combine the CMAQ model results with observations (OBS) (Fig. 2). Additionally, the OBS-CMAQ species concentrations can be used in combination with the emissions inventory to calculate mobile source impacts (Fig. 3). Where spatially resolved SMOKE modeled emissions estimates and OBS-CMAQ species concentrations for EC, CO and NOx (tracer species for mobile sources) are used to generate daily mobile source impacts.
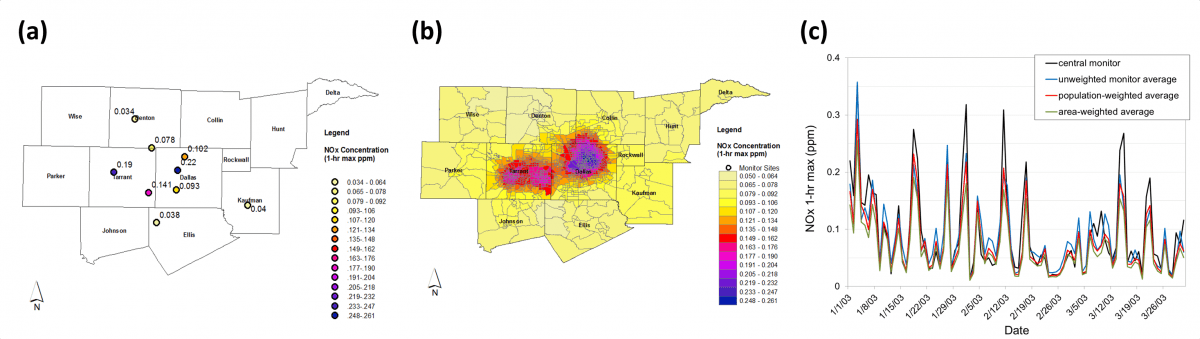
Fig. 1. Statistical Data Analysis: Dallas-Fort Worth (a) NOx 1-hr max 1 Jan 2003 (b) Population Weighted NOx 1-hr max 1 Jan 2003 (c) Daily NOx 1-hr max AQ metrics
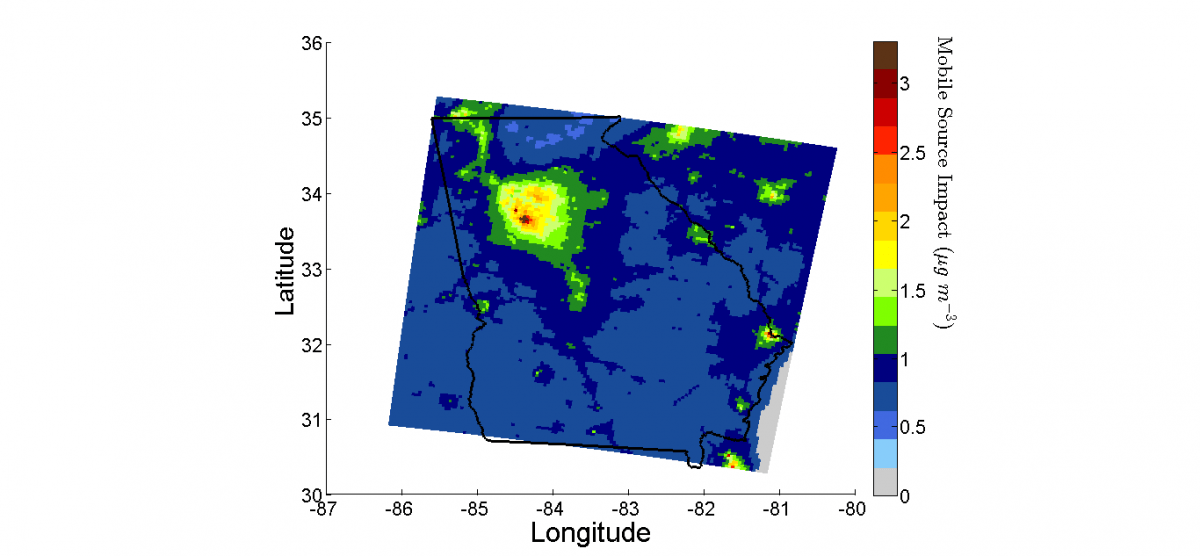
Fig. 2. Improved Spatial Concentration Estimates: Georgia 4-km resolution CMAQ simulated 8-hr Ozone 18 July 2010 (left) CMAQ and Observations (right) Fused CMAQ-OBS, spatially interpolated ratio of Observation to CMAQ concentration using ordinary kriging. Note scale difference on color axis.
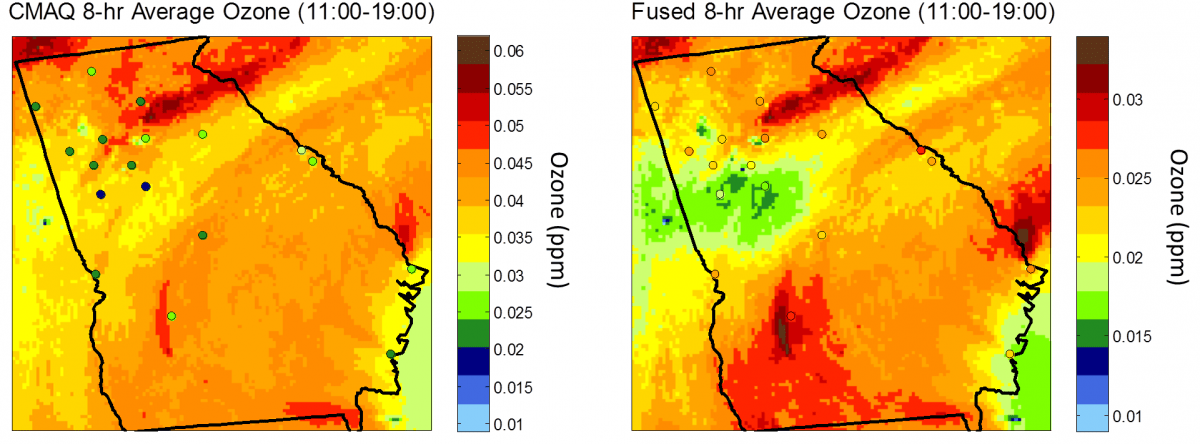
Fig. 3. Spatial Mobile Source Impact Estimates: 2010 annual average Georgia 4-km resolution using CMAQ-OBS EC, CO and NOx concentrations and emissions inventory data.
Source impacts are also estimated using traditional receptor oriented source apportionment (SA) methods, Chemical Mass Balance (CMB) and Positive Matrix Factorization (PMF) ), and source oriented modeling from CMAQ (CMAQ-DDM). As part of the MC Toolkit, two novel SA techniques are being developed to improve the characterization of exposure estimates by source emissions. First, an ensemble method that generates new source profiles for CMB based on an ensemble-trained approach utilizing results from CMB, PMF and CMAQ (Fig. 4, Fig. 5). The second is a hybrid source-receptor model approach that adjusts the original CMAQ-DDM source impact estimates based on scaling factors obtained using simulations and observations in a CMB-fashion optimization (Fig. 6).
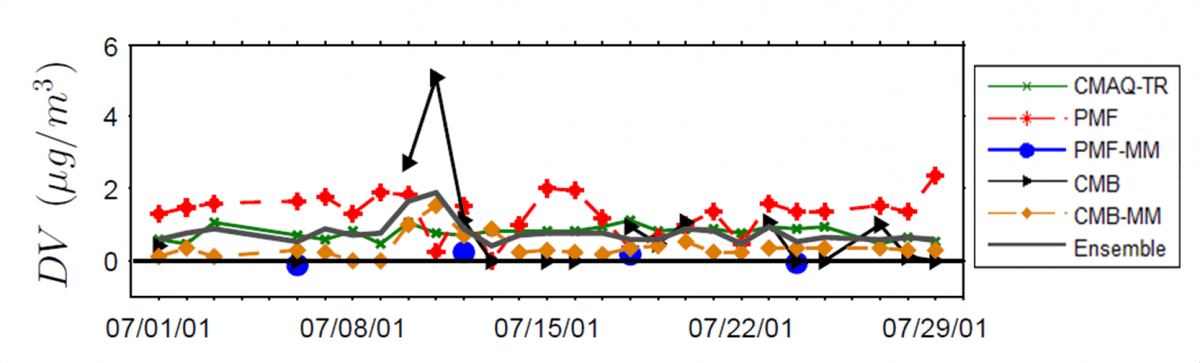
Fig. 4. Ensemble Source Apportionment: St. Louis daily Diesel Vehicle source impact estimates using receptor (PMF, CMB) and source (CMAQ-TR) models plus Ensemble method combining all SA approaches.
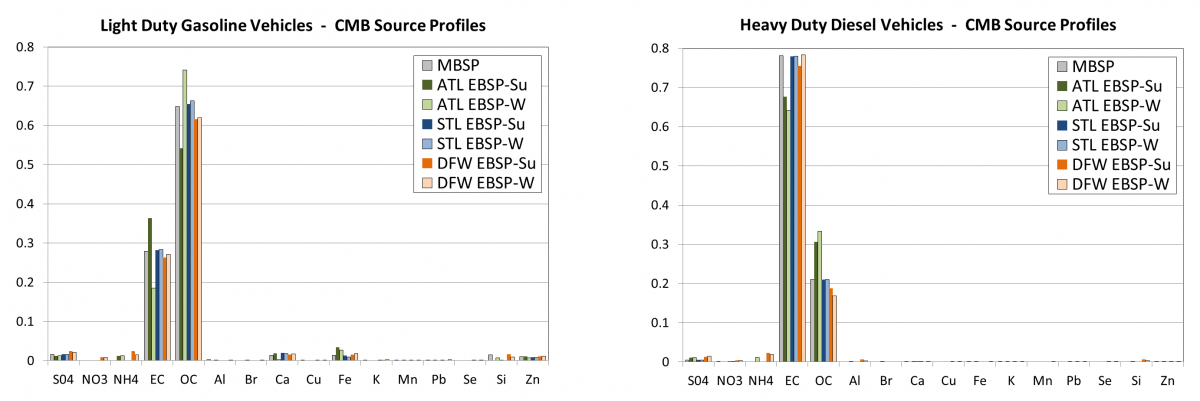
Fig. 5. Ensemble Source Apportionment: Comparison of measurement based (MBSP) and ensemble based (EBSP) summer and winter source profiles used in CMB for Atlanta (ATL), St. Louis (STL) and Dallas-Fort Worth (DFW).
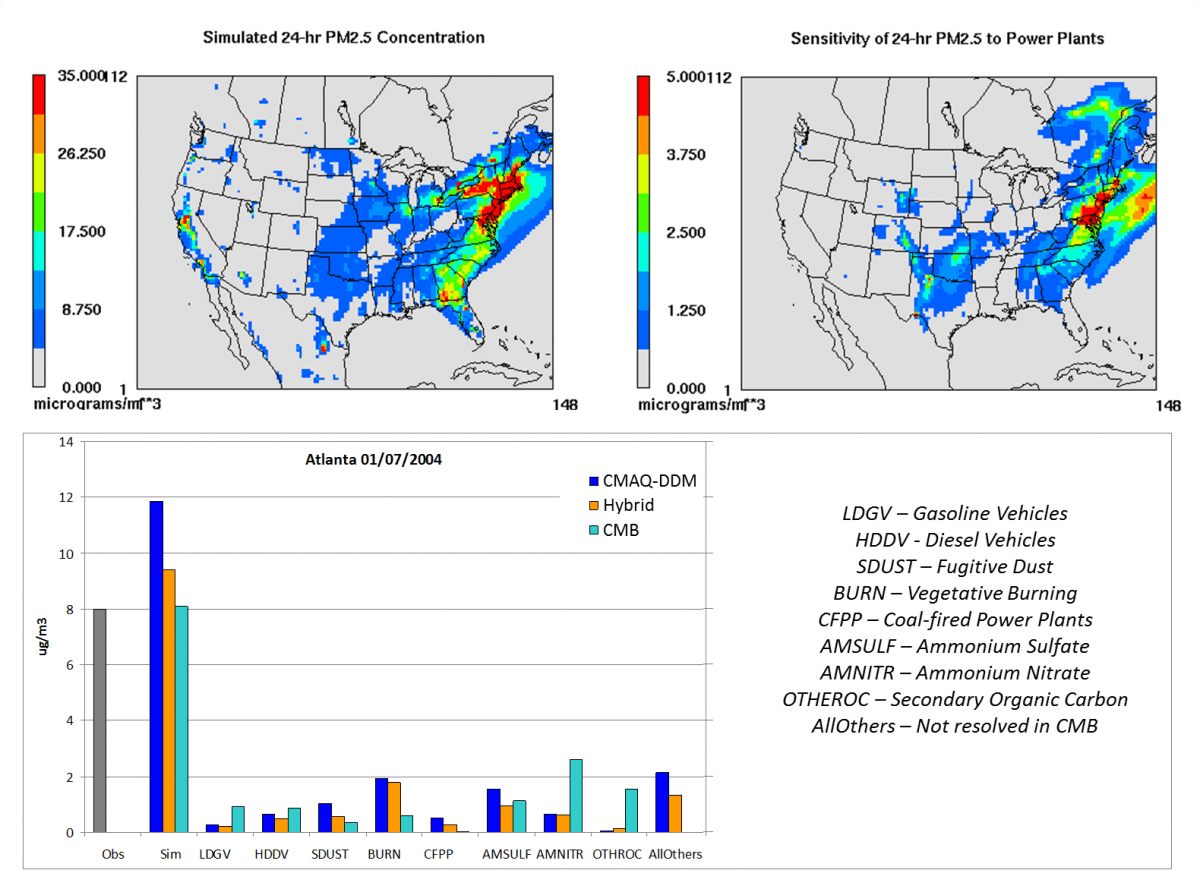
Fig. 6. Improved Spatial Resolution for Sources: (top) CMAQ-DDM 36-km resolution PM2.5 and CFPP source impacts (bottom) Atlanta SA methods comparison: CMAQ-DDM, Hybrid (CMAQ-CMB), CMB
This focus of the SCAPE Air Quality Core is to apply the MC Toolkit to data collected from regulatory and special monitoring networks to generate source impact estimates for acute health effects studies. Various products from the MC Toolkit will be used to identify associations between air pollution sources and health outcomes (e.g., hospital admissions and emergency department visits). The spatially resolved health studies will focus on the state of Georgia (SCAPE-Project 3) and the time series analysis will be done in five US cities Atlanta, St. Louis, Dallas-Fort Worth, Birmingham and Pittsburg (SCAPE-Project 4).
Assessment of Spatial Aerosol Composition in Atlanta (ASACA)
(Kyle Digby, Rawan El-Afifi)
The ASACA program began in March of 1999 at the Georgia Institute of Technology. Since then, the program has provided daily PM2.5 concentrations and speciation at several monitoring sites around metropolitan Atlanta. At the beginning of the project, there were three urban monitoring sites located at Fort McPherson, South Dekalb, and Tucker. In 2002, another site was set up at Fort Yargo to characterize rural PM2.5 concentrations and is sampled every third day. In January 2007, the Tucker site was retired and the Fire Station 8 site was set up. The Fort McPherson site was retired in 2011.
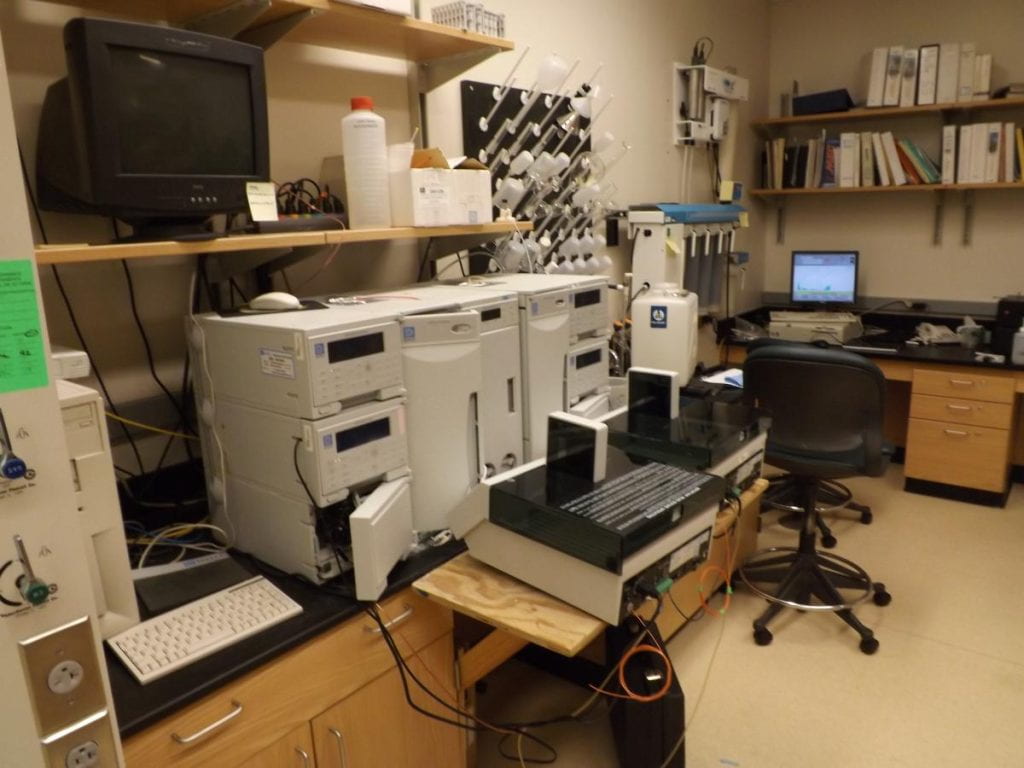
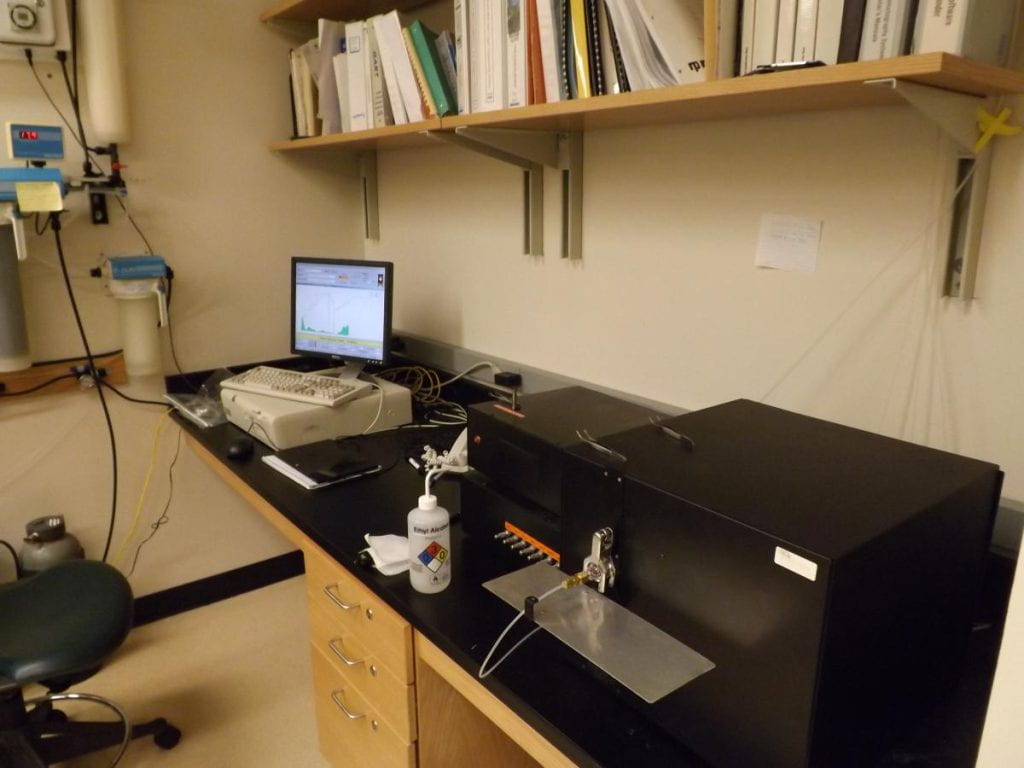
These sites collect data through three-channel particle composition monitors (PCMs) that pump ambient air through nylon, Teflon, and quartz filters for 24 hours. Additionally, data is occasionally collected through continuous measurement instruments such as a Tapered Element Oscillating Microbalance (TEOM) and an Aethalometer. Filters are taken back to the ASACA lab in the Environmental Science and Technology building at Georgia Institute of Technology and analyzed. Nylon filters are analyzed using Ion Chromatography for ion data, while quartz filters are analyzed using Thermal Optical Transmittance for elemental carbon and organic carbon data. Teflon filters are analyzed by an external lab for metal species. This data is then used in several research projects within the Russell group.
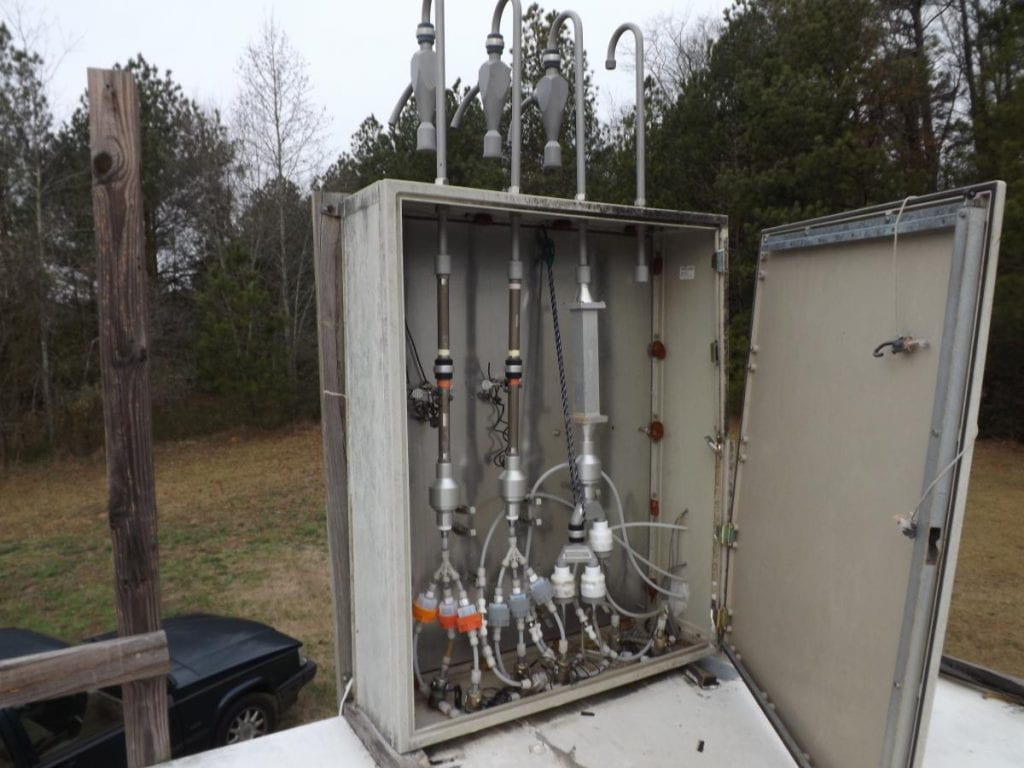
Characterizing the Emissions of Fine Particulate Matter in the Vicinity of a Rail Yard
(Georgia DNR; Boris Galvis)
Rail yards have the potential to significantly influence local fine particulate matter concentrations through emissions from diesel-electric locomotives and supporting activities .This is of concern in urban areas where rail yards are in proximity to dwellings. Diesel emissions have suspected negative effects on human health. One of the main components of diesel emissions is black carbon (BC). BC from diesel and other fossil fuels absorbs solar radiation, affecting visibility and climate. Recent emission inventories in the United States indicate that mobile diesel engines, which include locomotives, are the greatest potential area for BC mitigation applying currently available control technologies. Reductions in emissions from major sources of PM2.5 and BC that affect densely populated areas can provide near-term environmental and public health benefits at low relative cost.
Northwest of Atlanta, Georgia, Inman and Tilford rail yards are located beside residential neighborhoods, industries, and schools (Fig. 1). PM2.5 concentrations in Atlanta have been decreasing over the past ten years, but the Fire Station 8 site (FS) near the rail yards has consistently showed the highest annual average PM2.5 concentration reported at any of the Georgia state-run monitoring sites (Fig. 2), suggesting that rail yard associated emissions play an important but still undetermined role in local air quality.In this project we quantified the impact of the aerosol emissions from Inman and Tilford rail yards on local concentrations of PM2.5. Specifically, BC and PM2.5 fuel-based emission factors from the rail yards by carbon balance using high time resolution monitoring (Fig. 3) were estimated; a composition profile of the rail yard aerosols using chemical speciation techniques was identified; local BC and PM2.5 rail yard emissions were estimated and dispersion modeling was applied to assess the impact of the rail yards; and baseline information that will allow a later evaluation of the improvement of local air quality as switcher locomotives operating in the rail yards are replaced by cleaner technologies was generated.
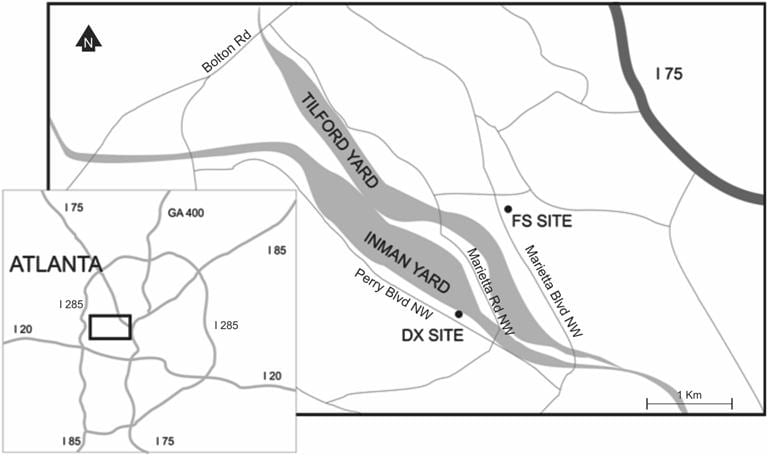
Fig. 1 Schematic of the location of the study. The two monitoring sites are at the Dixie (DX) and Fire Station 8 (FS) locations.
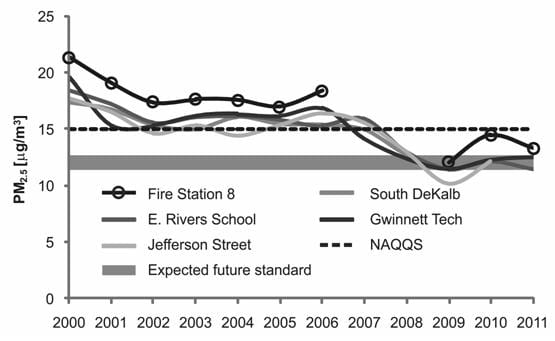
Fig. 2 PM2.5 annual arithmetic means at Atlanta urban sites.
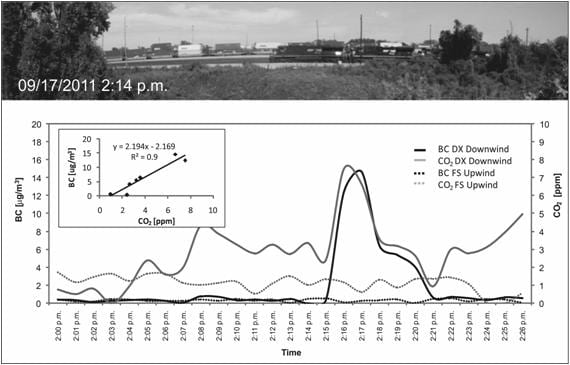
Fig. 3 Event associated with a locomotive at the DX site on September 17, 2011. At 2:14 p.m. a train passes by the monitoring site. An event is detected shortly after. The subplot shows the lineal regression of the event detected.
Impacts of Emission Changes on Air Quality and Acute Health Effects in the Southeast 1993-2012
(HEI; Lucas Henneman, Heather Holmes)
This is a joint Georgia Tech – Emory project funded by the Health Effects Institute that takes advantage of existing long-term air quality, meteorology and acute health effect data to develop and apply methods for assessing human health benefits of regulatory actions to improve air quality. Expected outcomes of this study include the development of empirical and model- based approaches and estimates of emissions-air quality relationships and uncertainties, meteorology-air quality relationships, emissions-health relationships and uncertainties, and changes in concentration-response functions over time. These results will lay the foundation for future work to predict air quality and health impacts of proposed emissions controls and how meteorological changes will impact air quality and related health responses.
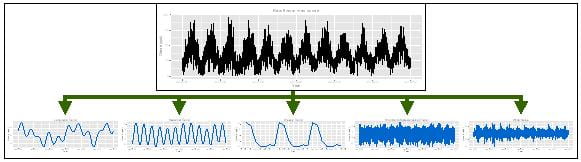
Decomposition of ozone into its long-term, seasonal, weekly, short-term meteorological, and white noise terms. This decomposition is necessary in order to assess the impacts of controls on air quality. Further statistical techniques are used to remove the effect of meteorology on daily concentration metrics.
Spatial and Temporal Extension of a Novel Hybrid Source Apportionment Model
(SCAPE; Sunni Ivey, Yongtao Hu)
A novel source apportionment model was developed that incorporates data from CMAQ and observation networks to produce improved source impact estimates at monitoring locations. Sources analyzed include on- and off-road gasoline and diesel sources, seven biomass burning sources, sea salt, and sources influenced by secondary processes (livestock and biogenic sources). Kriging is used to spatially interpolate hybrid results to apply the hybrid model to the entire CMAQ domain. Temporal interpolation is used to generate daily observation data for locations with one-in-three day data. Daily observation data allows use of the hybrid model to generate daily, improved spatial fields of source impact estimates.
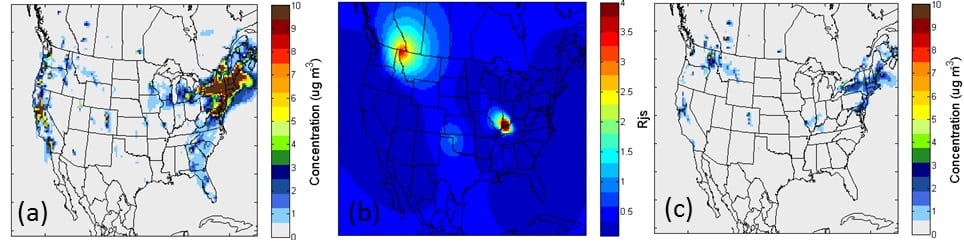
Hybrid adjustment of 36-km CMAQ woodstove PM2.5source impacts on Jan 4, 2004. (a) Original CMAQ simulations. (b) Spatial field of kriged hybrid adjustment factors. (c) Hybrid-kriging source impacts.
Effects of Climate Change on Air Quality
(Marcus Trail, Peng Liu, Yongtao Hu)
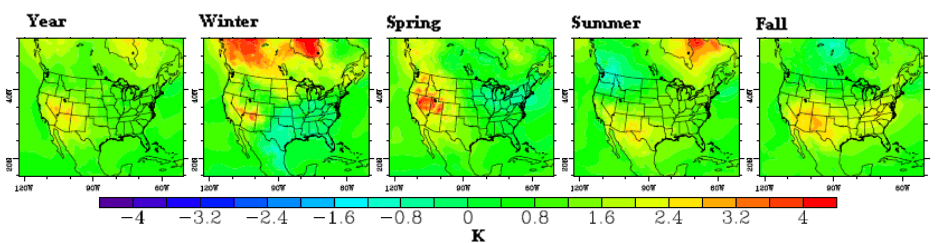
Air pollution has been and will continue to be a widespread public health and environmental problem over the U.S. The potential climate change may make the investigation of future air quality more complicated. On one hand, climate change can directly affect pollutant on both its concentration and composition of via the dispersion of pollutants, chemical production and loss rate, deposition rate, emission strength, dust and etc, and the background concentrations of relative chemicals. On the other hand, strategies or policies, which are designed to deal with global climate change, such as carbon capture technologies and use of biofuels, may also affect air quality. Technologies and policies designed to reduce global warming by mitigating the emissions of green house gases, may at the same time affect emissions of pollutants that lead to and PM2.5 and ozone. Therefore, the climate project is aimed at studying future air quality of the US under the conditions of climate change and its corresponding strategies or policies.
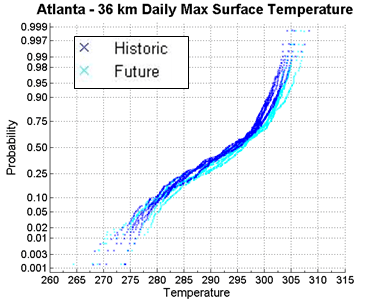
In order to link the future change in climate, emissions and other factors to air quality, the framework and main model platforms of this project are based on the “Models-3” regional air quality modeling system, which has three primary components, a regional meteorological model, an emissions processor, and a chemical transport model (CTM). The information of future climate is generated by NASA Goddard Institute for Space Studies (GISS) ModelE.
Impacts of Energy Sector Emissions on Air Quality
(Phillips 66; Wenxian Zhang, Yongtao Hu)
This project focuses on assessing the emission impact of energy sectors on air quality using air quality models. The modeling work of this project is conduced using the Community Multiscale Air Quality (CMAQ) model, which is one of the most widely used regional air quality model in current air quality management. The direct sensitivity techniques imbedded in CMAQ (i.e., CMAQ-DDM3D) is used to assess the emission impact. A number of simulations have been conducted in various regions including St. Louis, New Jersey, Seattle, and Houston. The impact of different emission sources (point, on-road and non-road mobile, area, biogenic, and specific refineries) on ambient ozone and PM2.5 concentrations in those regions has been estimated. Recent modeling of flare emission impact explores how temporally variable combustion efficiency (CE) instead of constant CE would change the emission of flare VOC emissions and what effects it would have on the ozone formation in the Houston region.
In addition to the model applications in emission impact assessment, this project places great efforts on development and implementation of advanced sensitivity techniques. Two types of sensitivity techniques are developed. One is the direct sensitivity analysis, or the forward sensitivity. It is source oriented and is efficient in estimating the impact of emission change on pollutant concentration. This project implemented high-order DDM sensitivity analysis for particulate matter in the CMAQ model, enabling quantification of nonlinear response of particulate matter to precursor emissions. An initial application of this method is to conduct uncertainty analysis for CMAQ simulated PM2.5 in the presence of uncertain emission rates. The other sensitivity technique is adjoint. This method is receptor oriented and is efficient in attributing the change in pollutant concentrations to emission sources. This project has implemented adjoint for the aerosol module of CMAQ and the cloud droplet parameterization in GEOS-Chem. It has been applied to improve estimates of ammonia emissions and to elucidate the emission responsible for cloud droplets over four distinct regions.